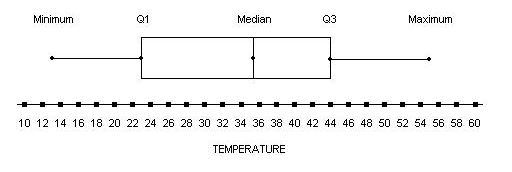
A box plot, also called a box and whisker plot due to the extensions away from the box referred to as the whiskers, shows five points of data: the median, the first and third quartiles, and the minimum and maximum values. On our box plot, we are measuring temperature and can see that we have a median temperature of 36 degrees, which is the line, usually closer to the center of the box. The actual box represents the middle 50 percent of data, saying that 50 percent of the temperatures were found between 23 and 44 degrees. The extensions away show the relative max and min, 55 and 13 degrees respectively.
http://weatherstories.ssec.wisc.edu/stories/armistice_day/climate.html
No comments:
Post a Comment