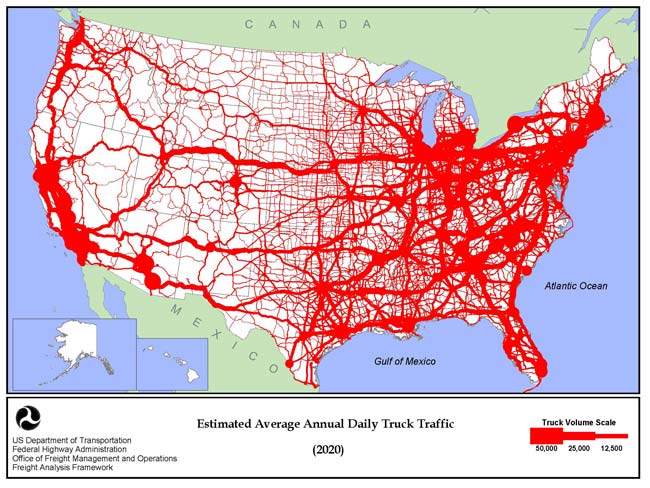
Above is the estimated daily truck traffic for the year 2020 in the United States. Because it dipicts linear movement between destinations and the width of the lines are proportional to the amount of truck traffic it qualifies as a flow map. Possible other uses for flow maps include civilian traffic patterns and corporate service routes for train or airline destinations. The red lines represent U.S. highways, and the thicker the line, the higher average number of trucks it represents. The line can represent up to 50,000 trucks a day.
http://www.frontiernet.net/~shirleyp1/4lane20/map-trucks-2020.html
No comments:
Post a Comment